
In most professional roles, the person at the top of the pay range earns 50% more than the person in the middle. The national data shows what those ranges look like and gives you a framework for arguing your case.
The question that actually matters
Most pay negotiation advice tells you to research what your job is worth. That is useful. But it misses the more important question: within the range for your role, where do you sit and where could you credibly argue you belong?
The national data from the ONS Annual Survey of Hours and Earnings shows, for fifteen white-collar occupations, the spread of pay across the middle 50% of full-time earners. The variation within any single occupation is striking. In most roles, the 75th percentile earns somewhere between 30% and 60% more than the median. In some, the gap is wider still.
The upside: how large is the gap?
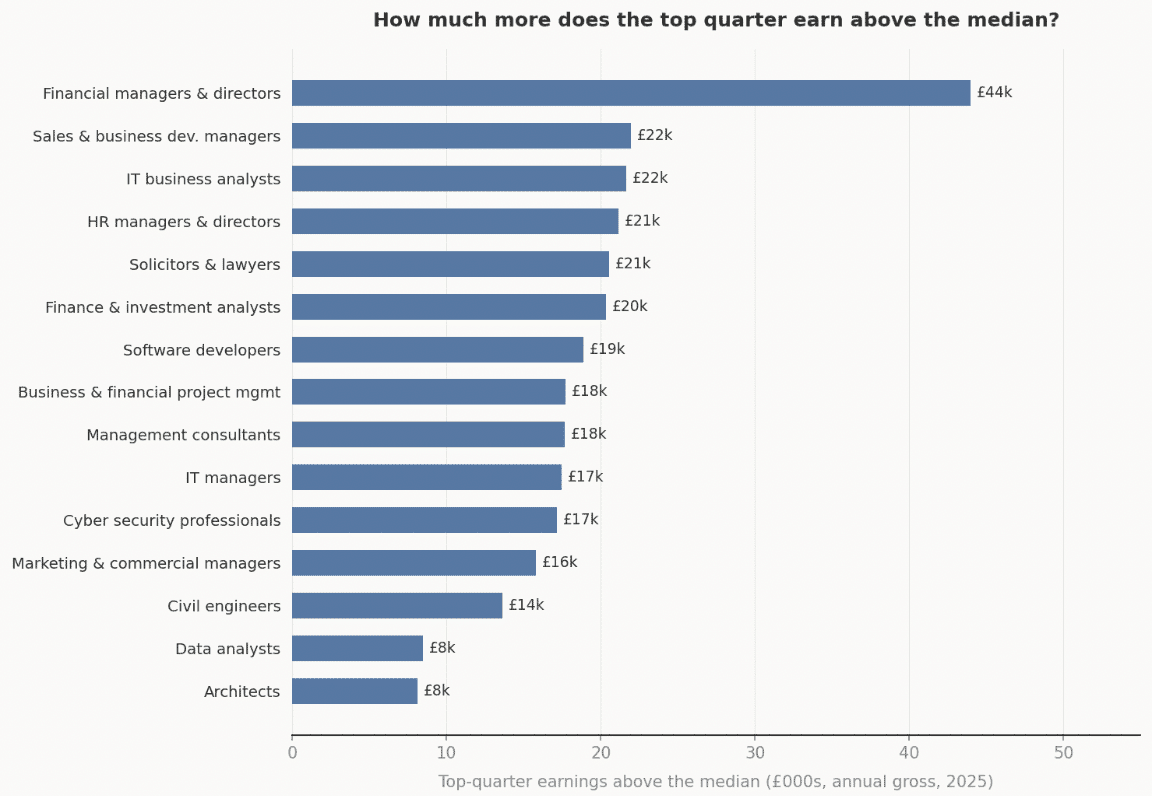
The difference between the median and the top quarter is a useful way to frame a negotiation. It tells you, concretely, how much room there is between where you probably are and where the market says high-performing people in your field get paid.
For financial managers and directors, that gap is approximately £44,000. The national 2025 median for the role is around £76,400, but the 75th percentile is above £120,000. These are not outliers. A quarter of full-time financial managers earn at least that. If you are in this field and performing at the higher end of your peer group, the data supports a conversation well above the midpoint.
At the other end of the scale, data analysts and architects both show an upside gap of around £8,000 to £8,500. That does not mean there is no negotiating headroom; it means the range is tighter and the argument needs to be more precise. The median for data analysts sits at roughly £38,600 and for architects at around £47,100. The 75th percentile for both is real and reachable, but the distance is narrower.
Between those extremes, most professional roles show a gap of £15,000 to £22,000 between the median and the top quarter. Solicitors and lawyers have a gap of around £20,500, placing the top quarter above £77,500. HR managers and directors show a gap of approximately £21,000. Sales and business development managers: just under £22,000. IT business analysts: just over £21,600.
What the full range tells you
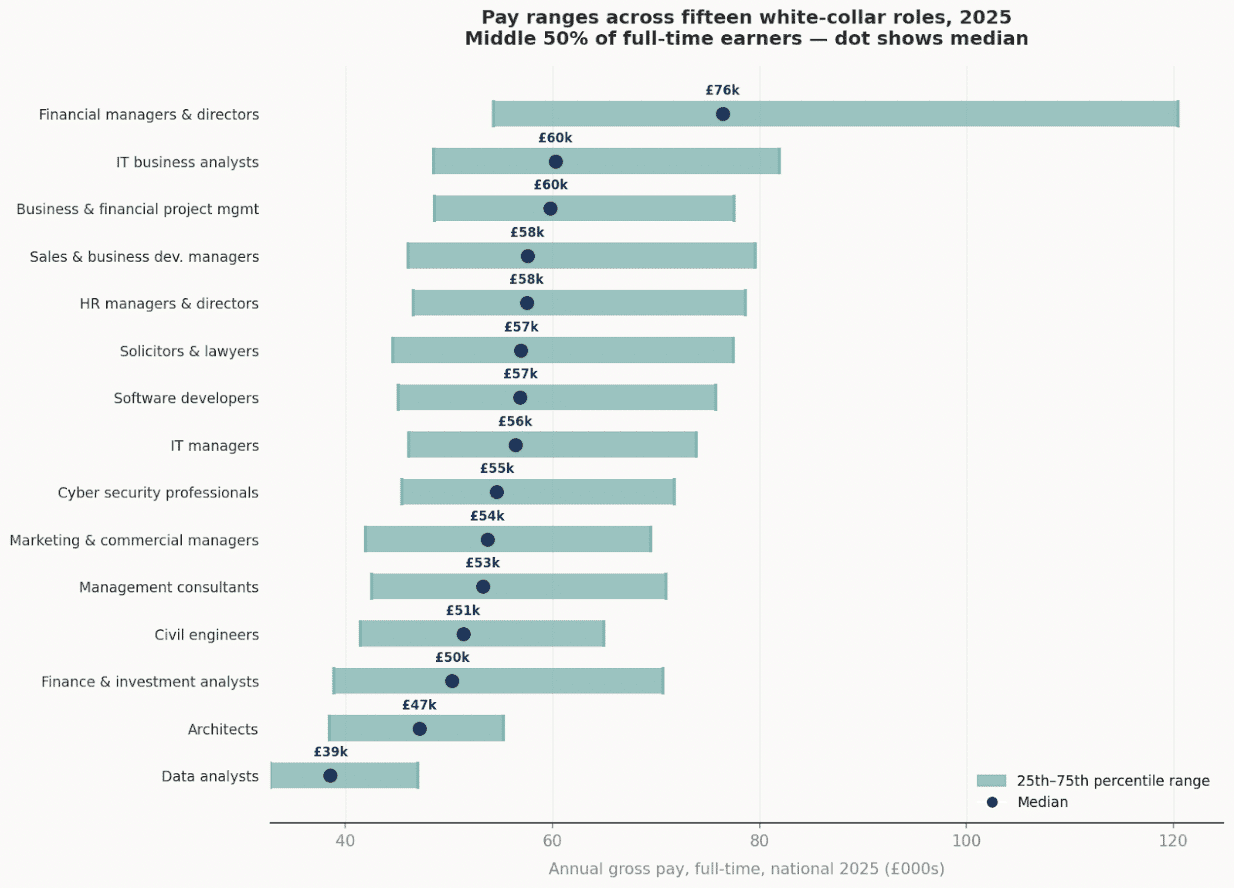
The second chart shows where those ranges actually sit. Several patterns stand out.
The range for IT business analysts runs from roughly £48,600 at the 25th percentile to just under £82,000 at the 75th – a spread of more than £33,000 across the middle half of earners. Software developers show a similar picture: £45,100 to £75,800. These are large, mature occupational categories where significant pay variation has become structural. The most senior or specialised people in both fields command a substantial premium, and the market has long supported it.
Solicitors and lawyers show a median of approximately £57,000 with the 25th percentile at around £44,600 and the 75th at over £77,500. The range is wide, but importantly the bottom of the range is not low for a qualified professional. This reflects a field with strong wage floors set by professional qualification requirements, but with significant upside depending on sector, employer and seniority level.
HR managers and directors sit at a median of roughly £57,500, with a range from around £46,600 to £78,700. The width of this range reflects how differently the HR function is valued across organisations. A senior HR business partner in a large financial services firm and an HR manager in a mid-sized regional business both fall within this occupational category. The gap between them is real.
Sales and business development managers show a similar spread: median near £57,600, top quarter above £79,600. The variation here tends to be driven by sector and the size of the deals or accounts being managed, rather than by seniority title alone.
At the lower end of the pay distribution in this dataset, data analysts (median £38,600) and architects (median £47,100) both have tighter ranges. For architects, the constraint is partly structural — the profession has strong qualification requirements, long training periods and significant self-employment, all of which compress the distribution. For data analysts, the tighter range may partly reflect the relative newness of the role as a defined occupational category; the data likely blends a wide range of actual functions.
The within-occupation insight
One finding from this data is worth stating plainly: the variation in pay within any single occupation is typically much larger than the variation in median pay between occupations.
The median for solicitors and lawyers (£57,000) is close to the median for software developers (£56,900) and HR managers (£57,500). But the 75th percentile for solicitors (£77,500) is slightly lower than for HR managers (£78,700), which is lower than for sales and business development managers (£79,600). These are not large differences at the median. They are more significant at the top.
More to the point: a solicitor performing at the 75th percentile for their occupation earns more than a data analyst performing at the median. The question of which occupation you are in matters less than where within that occupation you position yourself.
Using the data in a conversation
If you are preparing for a pay review, the first question is whether you know where you sit relative to the range for your role. If you do not, the national data gives you a starting point. The median is not a ceiling; it is the midpoint. A substantial share of people doing the same job as you are earning above it. If you are performing well, the case that you belong in the upper part of the range is not a stretch. It is a data-supported argument.
The second question is what justifies placement in the upper half of the range. The data does not answer this for you, but it frames the conversation. Specialisation, proven track record, specific technical depth, client relationships, revenue contribution, team leadership: these are the factors employers use when setting pay above the midpoint. Your job in a negotiation is not to argue that the median is too low, but to argue that your specific contribution, skills and market positioning place you above it.
A third point: the ranges shown here are for full-time employees nationally. Local labour markets, specific industries and individual employers can vary materially from the national picture. Use the national figures as an anchor and a floor for your expectations, not as the final word.
If you want to know more about pay for roles in your part of the UK come and visit www.wage-wizard.co.uk
I am excited my blog has been listed as one of the Top 100 Career Blogs on the web (2026 Edition)! Check out the other blogs here:
